

By Matt Gazaway
CERTIFIED FINANCIAL PLANNER®
Wealth Advisor | Partner
October 2026
Four years ago, the S&P 500 reached its lowest level of the 2022 bear market in October. At the time, inflation was climbing at its fastest pace since the 1970s, the Federal Reserve was raising interest rates rapidly, and recession fears were widespread. Sentiment among consumers, businesses, and investors was deeply negative, and it was difficult to imagine conditions improving.
Fast forward to today, and the situation couldn’t feel more different. Major indices are near all-time highs and the economy has been resilient, driving corporate earnings higher and keeping the unemployment rate low. Inflation is still a challenge with energy prices being a key source of uncertainty this year, but it is no longer rising at a double-digit pace.1 The S&P 500 has more than doubled over this period, supporting investors who have maintained a long-term focus in their portfolios and financial plans.
As the bull market enters its fifth year, the shift in investor sentiment over this period is an important reminder that market and economic conditions can turn around when they’re least expected. And while this is all positive for long-term investors who stuck to their plans, the goal is neither to celebrate nor become complacent, but to stay balanced and focused on long-term financial goals.
Perspective matters as we begin the fifth year of the bull cycle
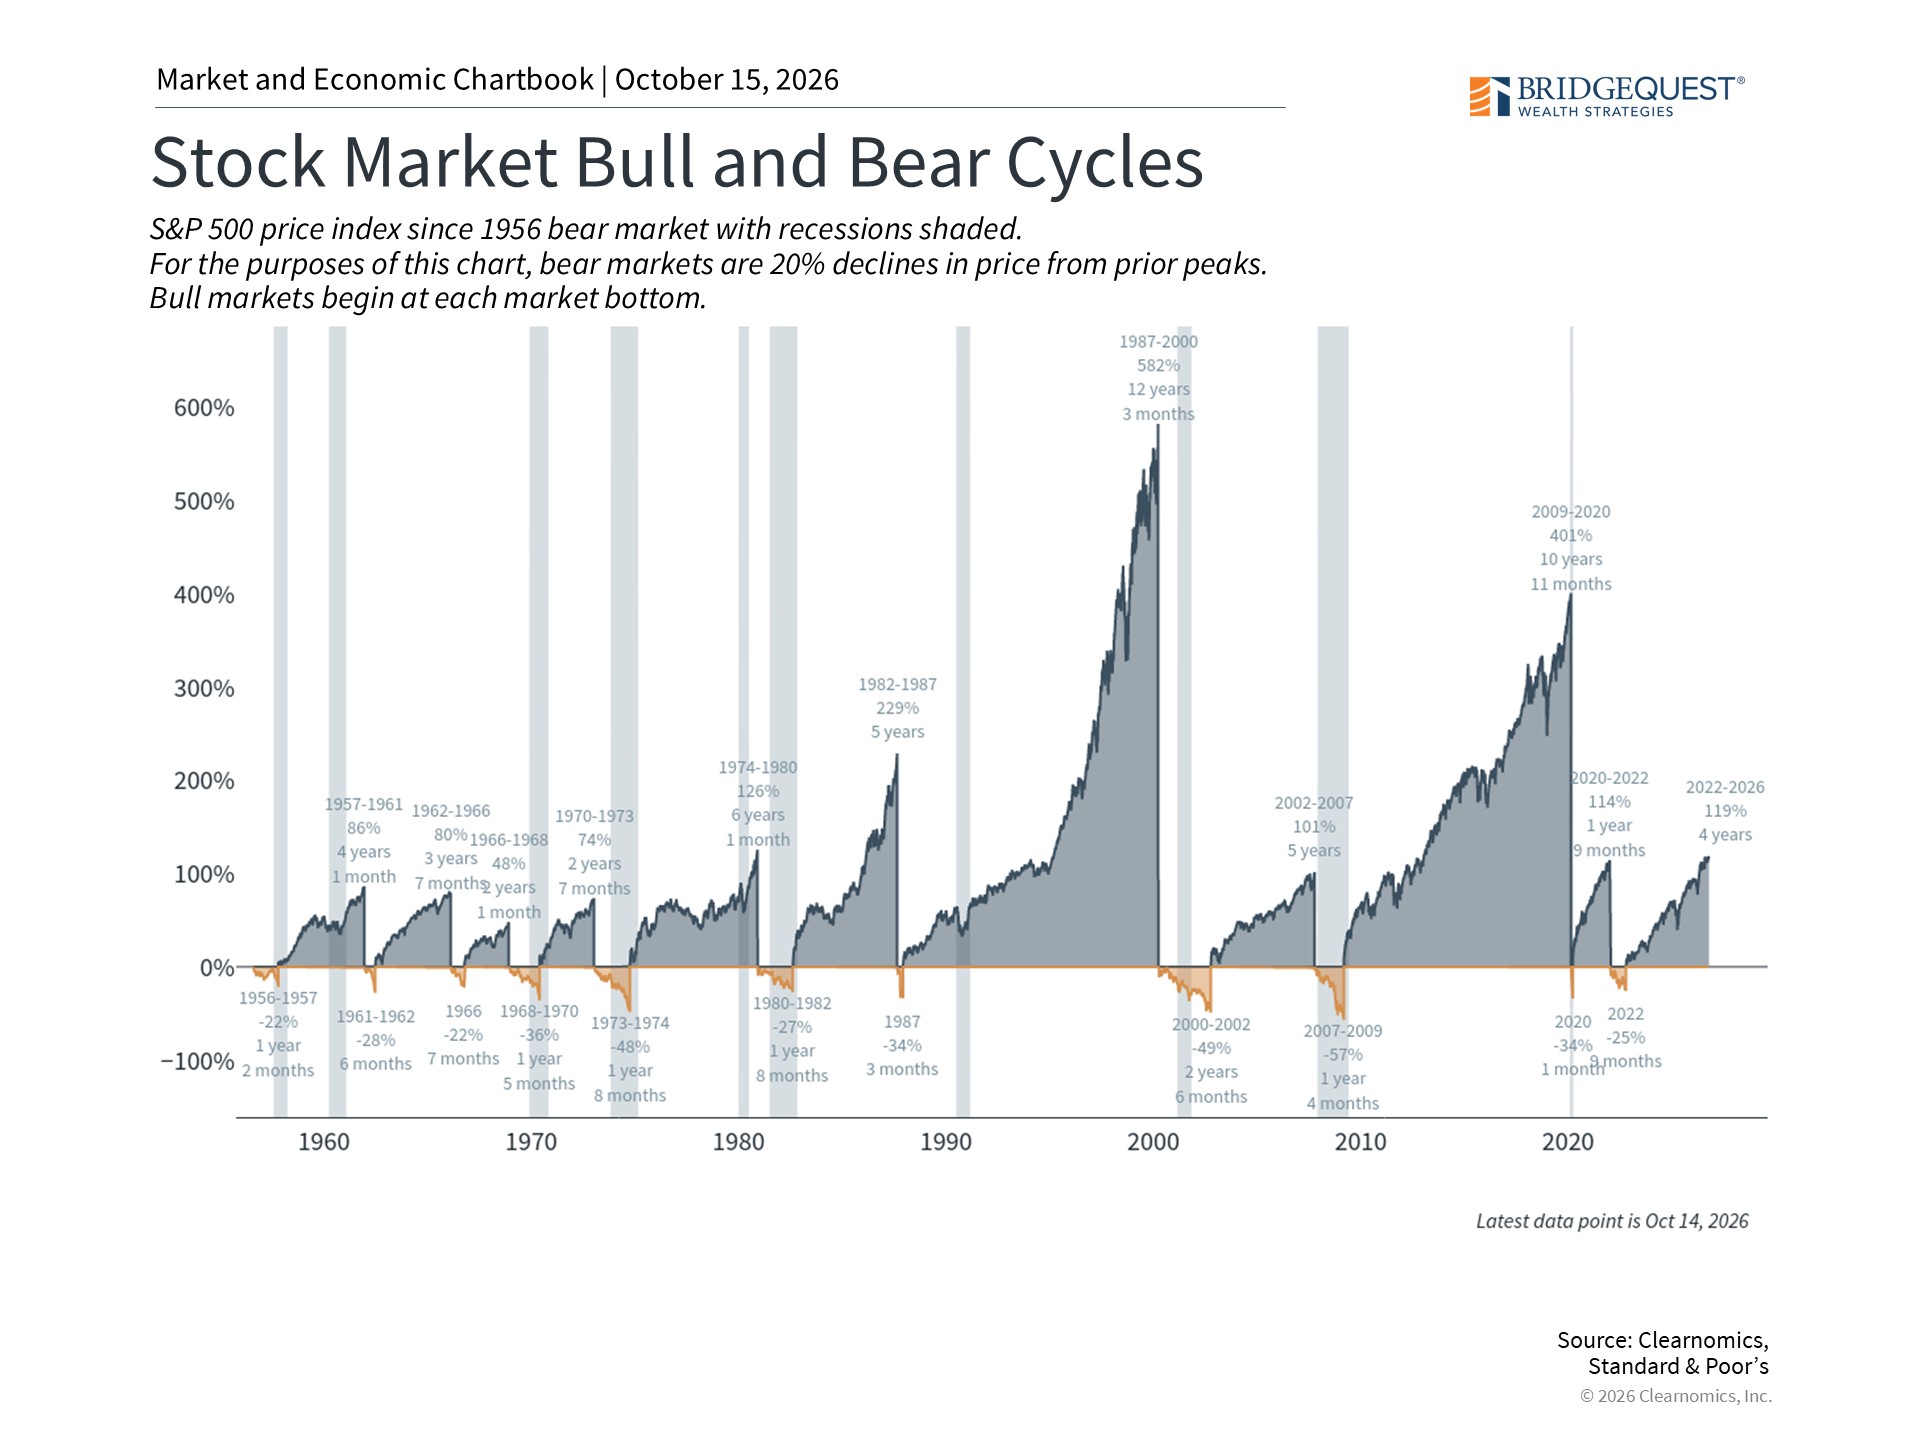
The S&P 500 reached its bottom on October 12, 2022, alongside other asset classes such as bonds, amid inflation concerns. Since then, the index has gained around 119% on a price return basis, and 131% with reinvested dividends.2 Not only does this mean that stock market holdings have more than doubled over this period, but this is now one of the strongest bull market cycles since World War II, as shown in the chart above.
Historically, bull markets have lasted far longer than bear markets, often running five to ten years or more, including two recent cycles that lasted more than a decade. Of course, no two market cycles are identical, and past performance is no guarantee of future results. After all, markets never rise in a straight line.
The market cycle that began in 2020, for instance, was interrupted in 2022 due to inflation. At the same time, many challenges that seemed important at the time only became temporary speed bumps. For instance, the long bull markets of the 1990s and the 2010s each faced serious challenges along the way, including growth concerns, geopolitical events, fiscal challenges, oil price shocks, and periods of elevated valuations. And yet, consumers and businesses adapted to these conditions, allowing markets to recover.
Today’s cycle is no exception and has already faced periods of significant volatility, such as the sharp pullbacks in 2025 around tariffs and earlier this year due to the war in Iran. Zooming out, it’s easy to see that these episodes are a normal part of any market cycle. As the bull market continues, it’s an important time for investors to stick with a well-constructed portfolio that can handle all types of market environments.
New all-time highs are a normal part of the market cycle
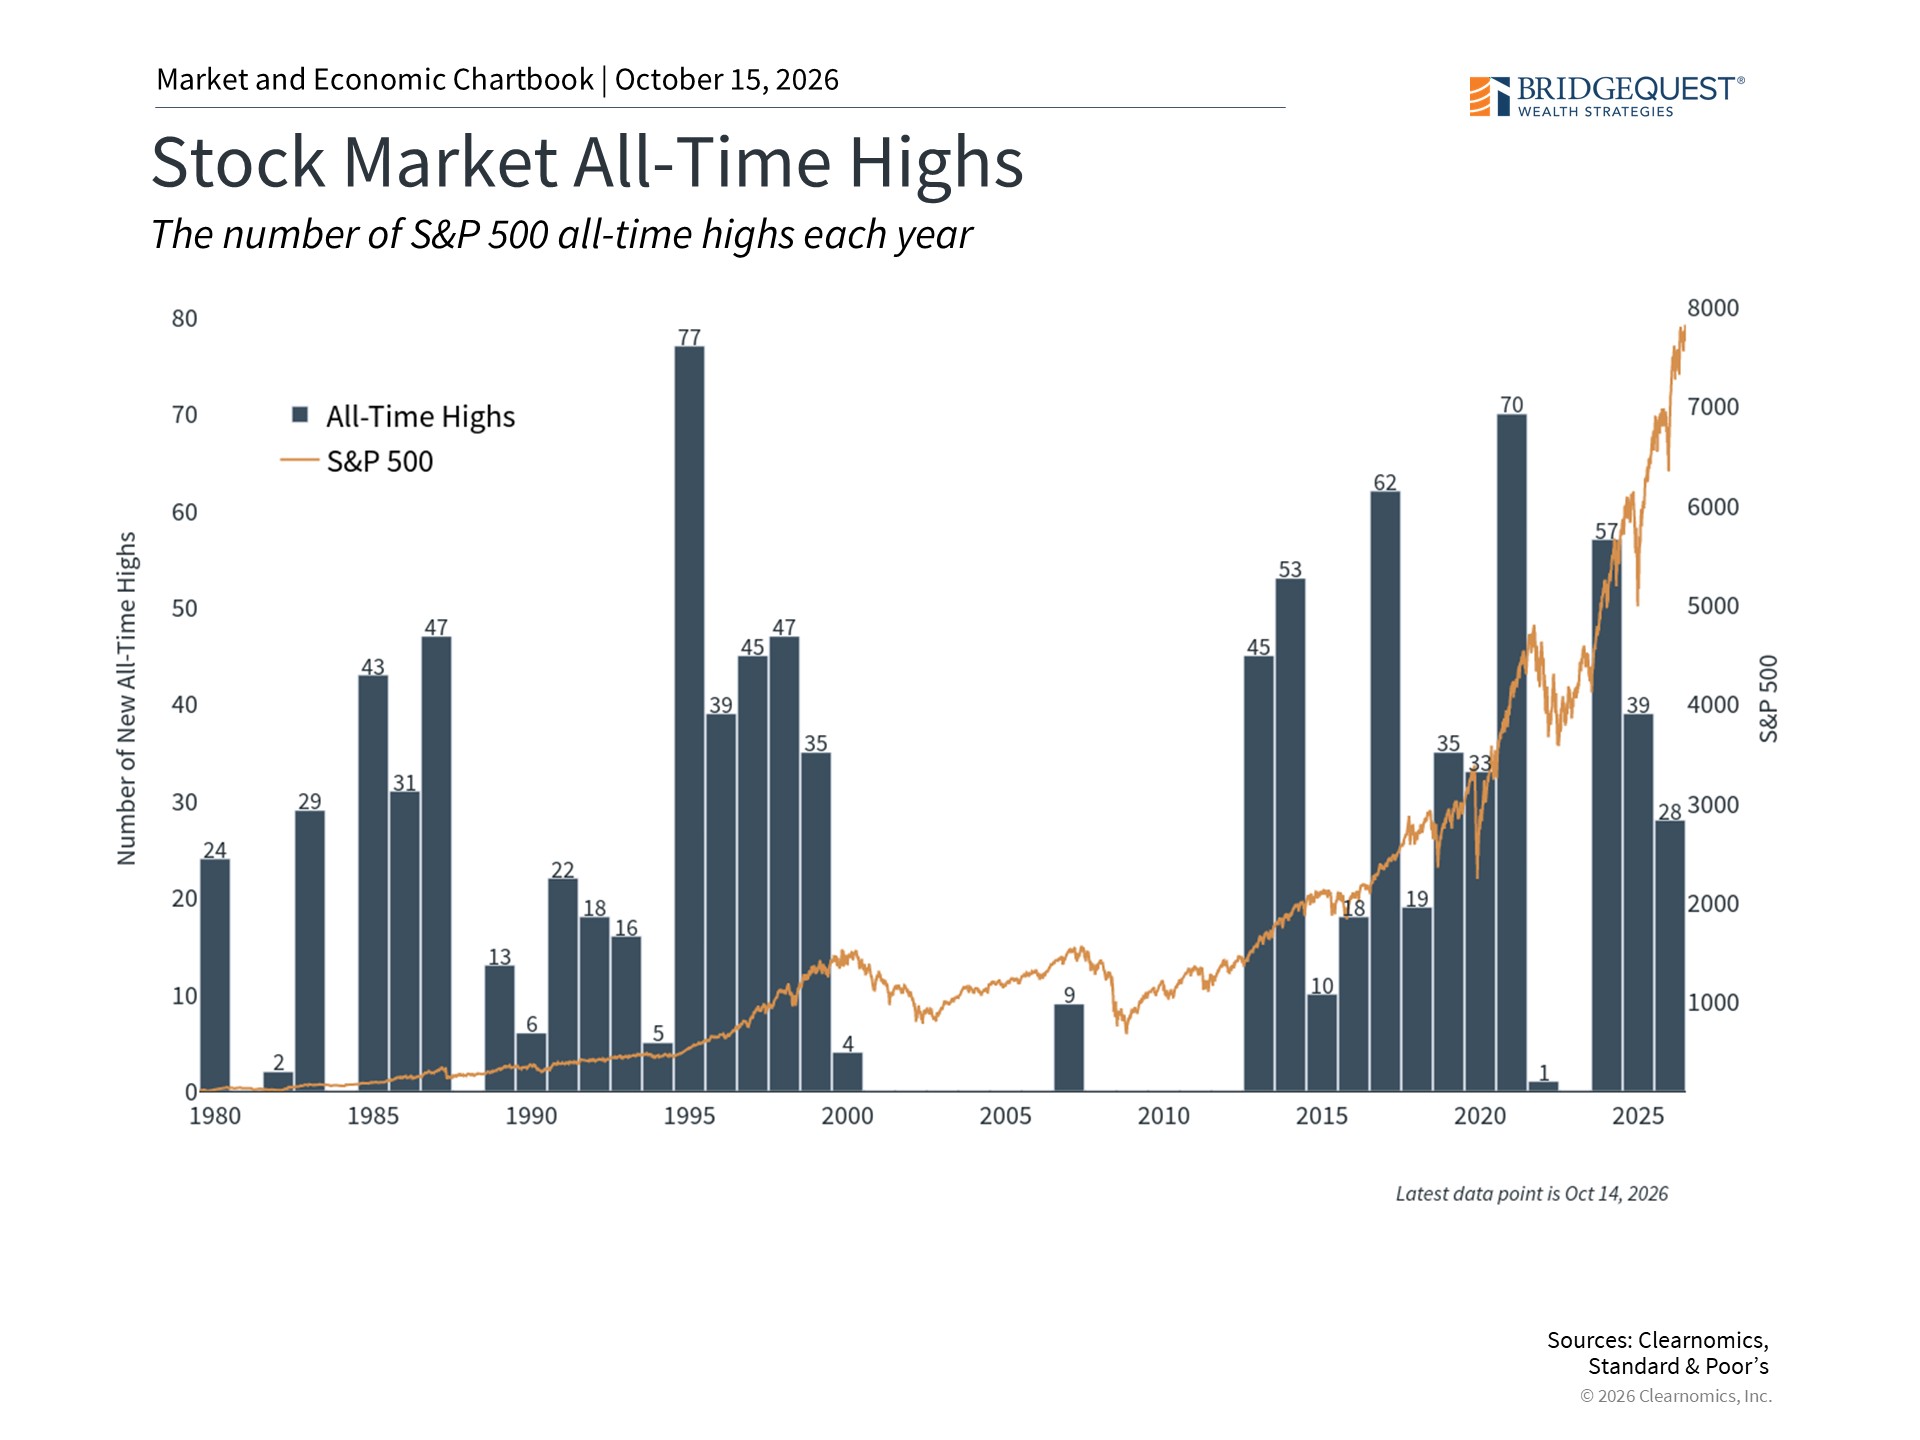
The market cycle hasn’t simply continued, but has reached record levels. This year alone, the S&P 500 has achieved more than two dozen new all-time highs.3 This can lead to mixed feelings among investors, since some may worry that the market is “due for a pullback,” while others may feel that they’re missing out.
As always, it’s important to stay balanced and to have a longer historical perspective. The chart above shows how frequently the S&P 500 has set new all-time highs across different market cycles. History shows that it’s not unusual at all for markets to rise steadily during bull markets and, by definition, achieve new all-time highs. Over the past decade, for instance, the S&P 500 has reached dozens of new highs each year, except during the bear market in 2022 and as major indices recovered in 2023.
This does not mean risks are absent or that new highs should be taken for granted. Rather, it reflects the fact that the economy and corporate sector have been resilient in the face of significant headwinds. Recognizing this pattern and resisting the urge to step aside every time markets approach record territory is one of the most valuable habits a long-term investor can develop.
Valuations have improved, but risk management remains important
Markets hovering at high valuations mean it’s important to consider potential opportunities across asset classes, as well as risk management. Valuations matter to long-term investors because they don’t just reflect the price of the stock market, but what you get for that price. This matters because investors own shares of stock to benefit from the earnings, cash flow, dividends, and other fundamental measures that they are entitled to. Valuation metrics take a ratio of the share price against each of these measures to show what investors are getting for that price.
The accompanying chart shows various valuation measures for the S&P 500. Strong earnings growth over the past year, including consensus estimates pointing to over 30% earnings growth for 2026, has helped bring the price-to-earnings ratio down from its peak just a year ago.4 This is a positive and suggests that much of the market’s gains have been supported by corporate profitability rather than by investor enthusiasm alone.
At the same time, valuations remain above their long-run historical averages based on other measures. Price-to-book, for instance, is a classic metric used by value investors, and suggests that the market is still expensive when considering company assets and balance sheets. The same is true for measures such as dividend yields, which are historically low when compared to interest rates and bond yields today. In addition, an important part of the story is that valuations appear high in technology-related sectors but can differ across many parts of the market.
It’s important to remember that valuations are not short-term timing tools, but help to position portfolios over years and decades. Markets can stay elevated for extended periods, especially when earnings growth is strong. That said, higher valuations can suggest that unless fundamentals change, the margin for error is smaller. This raises the importance of holding different asset classes to balance a portfolio, ensuring it stays aligned with long-term financial plans. Bond yields, for instance, are near multi-decade highs, making them more attractively valued.5
The bottom line? As the bull market begins its fifth year, it’s a good time to reflect on the positive developments over this market and economic cycle. Uncertainty is a natural part of investing, so staying balanced and focused on long-term financial goals remains important.
References
1. https://www.bls.gov/news.release/cpi.nr0.htm
2. Clearnomics research using Standard & Poor’s data, from October 12, 2022 to October 9, 2026
3. Clearnomics research and S&P 500 data, as of October 9, 2026
4. Clearnomics research and LSEG data, as of October 9, 2026
5. https://home.treasury.gov/policy-issues/financing-the-government/interest-rate-statistics
Index Descriptions
S&P 500
The Standard & Poor’s 500 Index is a capitalization-weighted index of 500 stocks designed to measure performance of the broad domestic economy through changes in the aggregate market value of 500 stocks representing all major industries.
Dow Jones
The Dow Jones Industrial Average is comprised of 30 stocks that are major factors in their industries and widely held by individuals and institutional investors.
NASDAQ
The NASDAQ Composite Index measures all NASDAQ domestic and non-U.S. based common stocks listed on The NASDAQ Stock Market. The market value, the last sale price multiplied by total shares outstanding, is calculated throughout the trading day, and is related to the total value of the Index.
MSCI Emerging Markets Index
The MSCI EM (Emerging Markets) Index is a free float-adjusted market capitalization weighted index that is designed to measure the equity market performance of the emerging market countries of the Americas, Europe, the Middle East, Africa and Asia. The MSCI EM Index consists of the following emerging market country indices: Brazil, Chile, Colombia, Mexico, Peru, Czech Republic, Egypt, Greece, Hungary, Poland, Qatar, Russia, South Africa, Turkey, United Arab Emirates, China, India, Indonesia, Korea, Malaysia, Philippines, Taiwan, and Thailand.
MSCI EAFE Index
The MSCI EAFE Index is a free float-adjusted market capitalization index that is designed to measure the equity market performance of developed markets, excluding the US & Canada. The MSCI EAFE Index consists of the following developed country indices: Australia, Austria, Belgium, Denmark, Finland, France, Germany, Hong Kong, Ireland, Israel, Italy, Japan, the Netherlands, New Zealand, Norway, Portugal, Singapore, Spain, Sweden, Switzerland and the UK.
Bloomberg US Aggregate Bond Index
The Bloomberg U.S. Aggregate Bond Index is an index of the U.S. investment-grade fixed-rate bond market, including both government and corporate bonds.
Securities and advisory services offered through Commonwealth Financial Network®, Member FINRA/SIPC, a Registered Investment Adviser. Fixed insurance products and services are separate from and not offered through Commonwealth Financial Network.
Investments are subject to risk, including the loss of principal. Some investments are not suitable for all investors and there is no guarantee that any investing goal will be met. Diversification does not assure a profit or protect against loss in declining markets. There is no guarantee that a diversified portfolio will outperform a nondiversified portfolio.
Copyright (c) 2026 Clearnomics, Inc. All rights reserved. The information contained herein has been obtained from sources believed to be reliable, but is not necessarily complete and its accuracy cannot be guaranteed. No representation or warranty, express or implied, is made as to the fairness, accuracy, completeness, or correctness of the information and opinions contained herein. The views and the other information provided are subject to change without notice. All reports posted on or via www.clearnomics.com or any affiliated websites, applications, or services are issued without regard to the specific investment objectives, financial situation, or particular needs of any specific recipient and are not to be construed as a solicitation or an offer to buy or sell any securities or related financial instruments. Past performance is not necessarily a guide to future results. Company fundamentals and earnings may be mentioned occasionally, but should not be construed as a recommendation to buy, sell, or hold the company’s stock. Predictions, forecasts, and estimates for any and all markets should not be construed as recommendations to buy, sell, or hold any security–including mutual funds, futures contracts, and exchange traded funds, or any similar instruments. The text, images, and other materials contained or displayed in this report are proprietary to Clearnomics, Inc. and constitute valuable intellectual property. All unauthorized reproduction or other use of material from Clearnomics, Inc. shall be deemed willful infringement(s) of this copyright and other proprietary and intellectual property rights, including but not limited to, rights of privacy. Clearnomics, Inc. expressly reserves all rights in connection with its intellectual property, including without limitation the right to block the transfer of its products and services and/or to track usage thereof, through electronic tracking technology, and all other lawful means, now known or hereafter devised. Clearnomics, Inc. reserves the right, without further notice, to pursue to the fullest extent allowed by the law any and all criminal and civil remedies for the violation of its rights.

Let Us Be Your Guide
At BridgeQuest Wealth Strategies, we specialize in helping clients navigate significant career transitions. We have a proven process that helps you understand all the different aspects of your transition. We'll help you figure out what's most important to you and develop a plan to make your transition as smooth as possible.
Check the background of your financial professional on FINRA's BrokerCheck.
Securities and advisory services offered through Commonwealth Financial Network®, Member FINRA/SIPC, a Registered Investment Adviser. Fixed insurance products and services are separate from and not offered through Commonwealth Financial Network.
The Financial Advisor(s) associated with this website may discuss and/or transact business only with residents of states which they are properly registered or licensed. No offers may be made or accepted from any resident of any other state. Please check Broker Check for a list of current registrations.
Information presented on this site is for informational purposes only and does not intend to make an offer or solicitation for the sale or purchase of any product or security.
Form CRS
Check the background of your financial professional on FINRA's BrokerCheck.
Securities and advisory services offered through Commonwealth Financial Network®, Member FINRA/SIPC, a Registered Investment Adviser. Fixed insurance products and services are separate from and not offered through Commonwealth Financial Network.
The Financial Advisor(s) associated with this website may discuss and/or transact business only with residents of states which they are properly registered or licensed. No offers may be made or accepted from any resident of any other state. Please check Broker Check for a list of current registrations.
Information presented on this site is for informational purposes only and does not intend to make an offer or solicitation for the sale or purchase of any product or security.
Form CRS
© BridgeQuest Wealth Strategies • Designed by Square Peg Marketing & Branding LLC